HeadBidders’ reporting interface helps to analyze revenue from sites and bidders, measure and compare the performance of sites and bidders, find and make decisions concerning opportunities or faulty setup, bidders, etc. and finding growth points.
Table or mixed Reports:
Auction Analysis (Overall) – Revenue per account.
Auction Analytics (by Bidder) – Same as previous one but broken by bidder.
Bidder Analysis (Overall) – Bidder performance analysis.
Bidder Analysis (by Ad Size) – Same as previous one but broken by ad size.
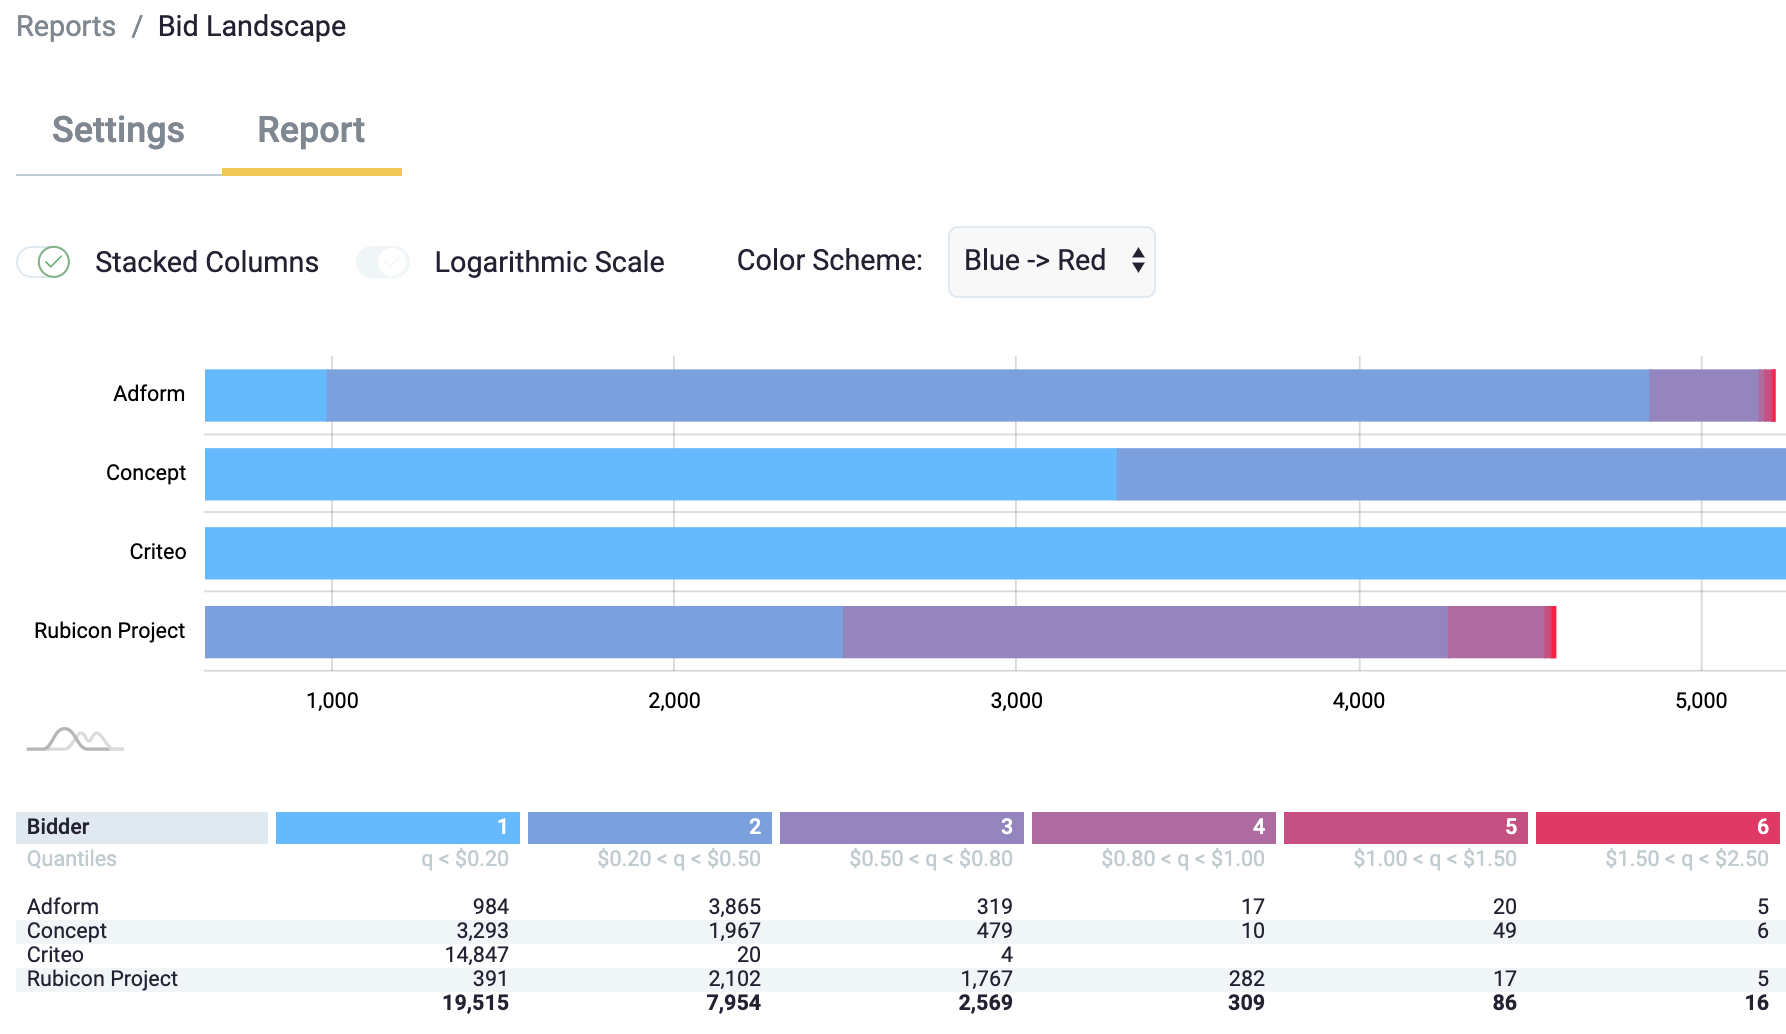
Bid Landscape – Combined Table/Graph report that shows bids grouped by its’ value and bidder name. Shows who bid higher.
Response Time Comparison - Combined Table/Graph report that group bids by response time and bidder name. Shows who is the slowest bidder, who slow down whole process.
Graphical Analysis:
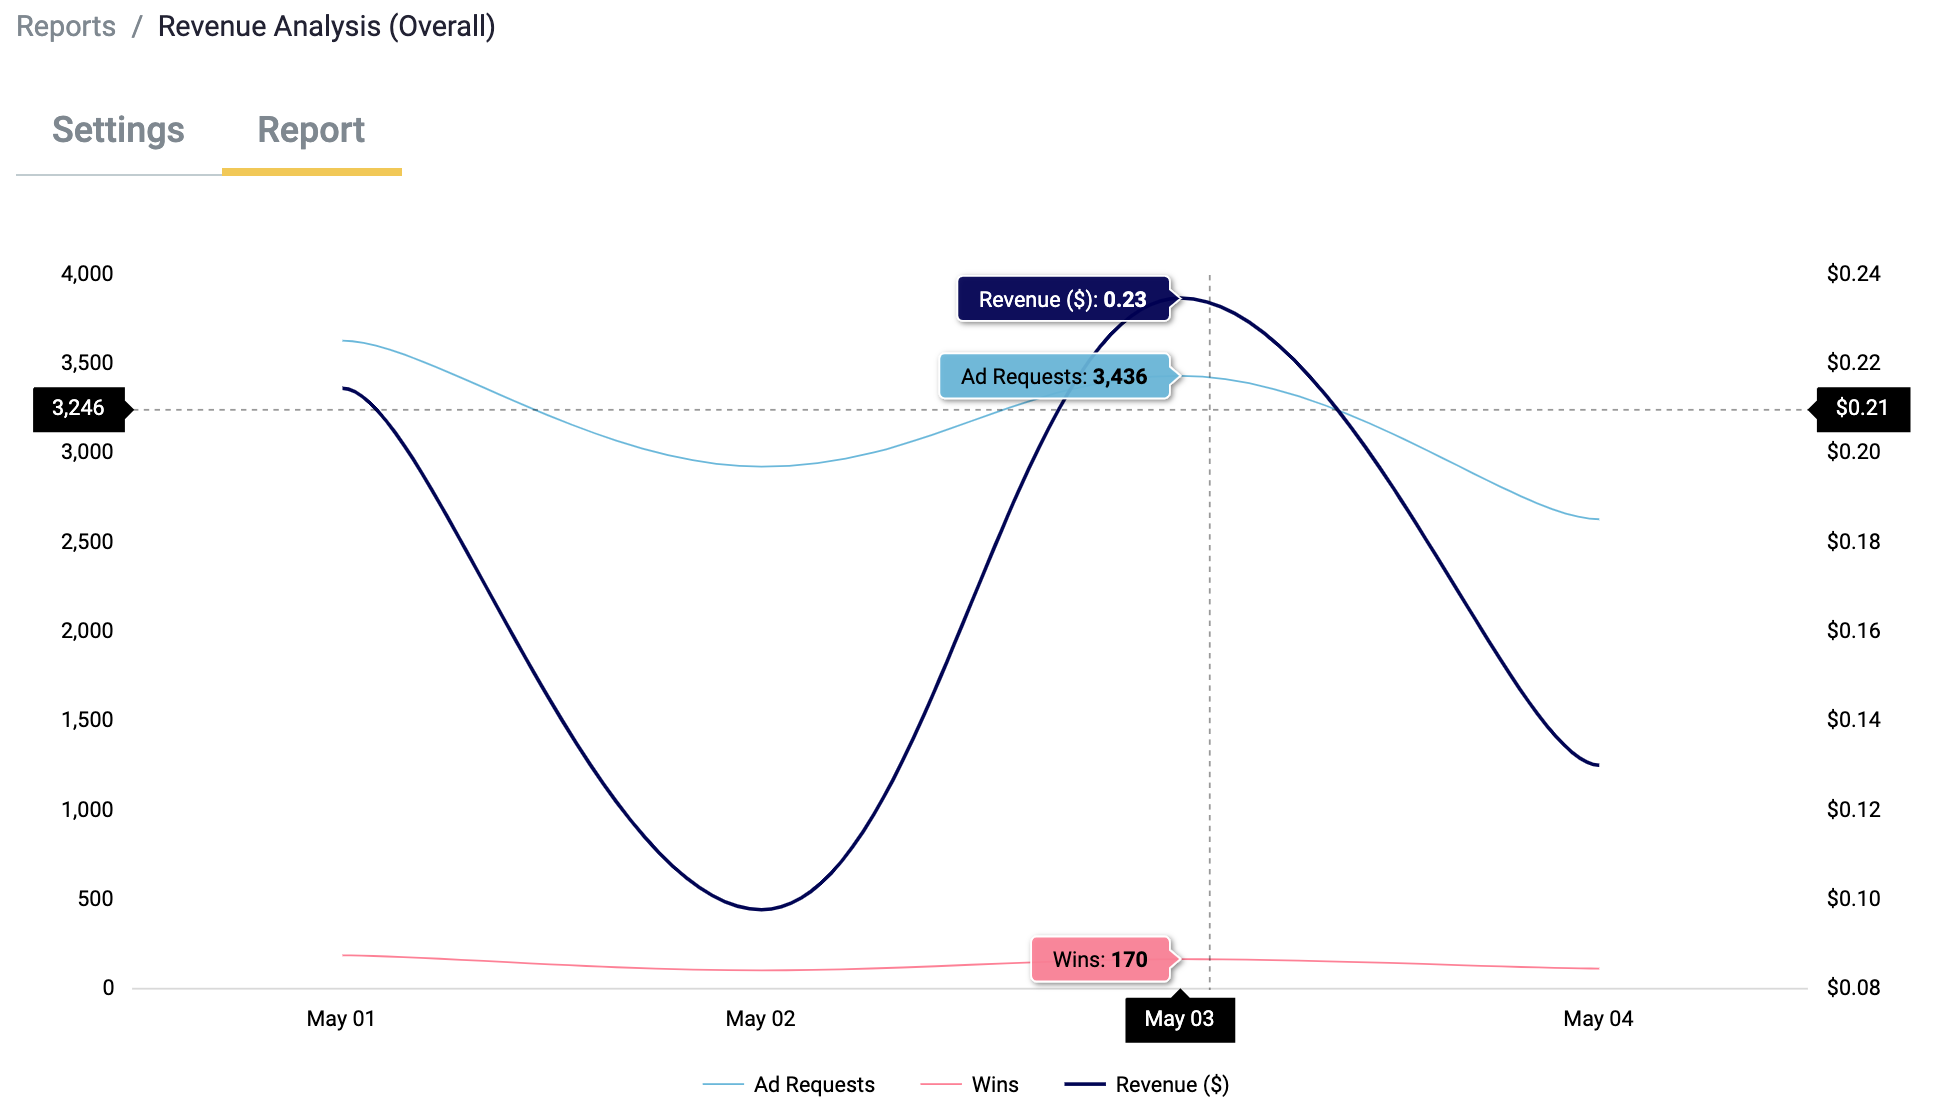
Revenue Analysis (Overall) – Graph shows main site revenue parameters for a given timeframe.
Revenue Analysis And Comparison – Graph allows to compare one item (ex. Sites) in your account by one revenue parameter for a given timeframe.
Bidder Performance (Overall) – Graph shows main bidding process parameters for a given timeframe.
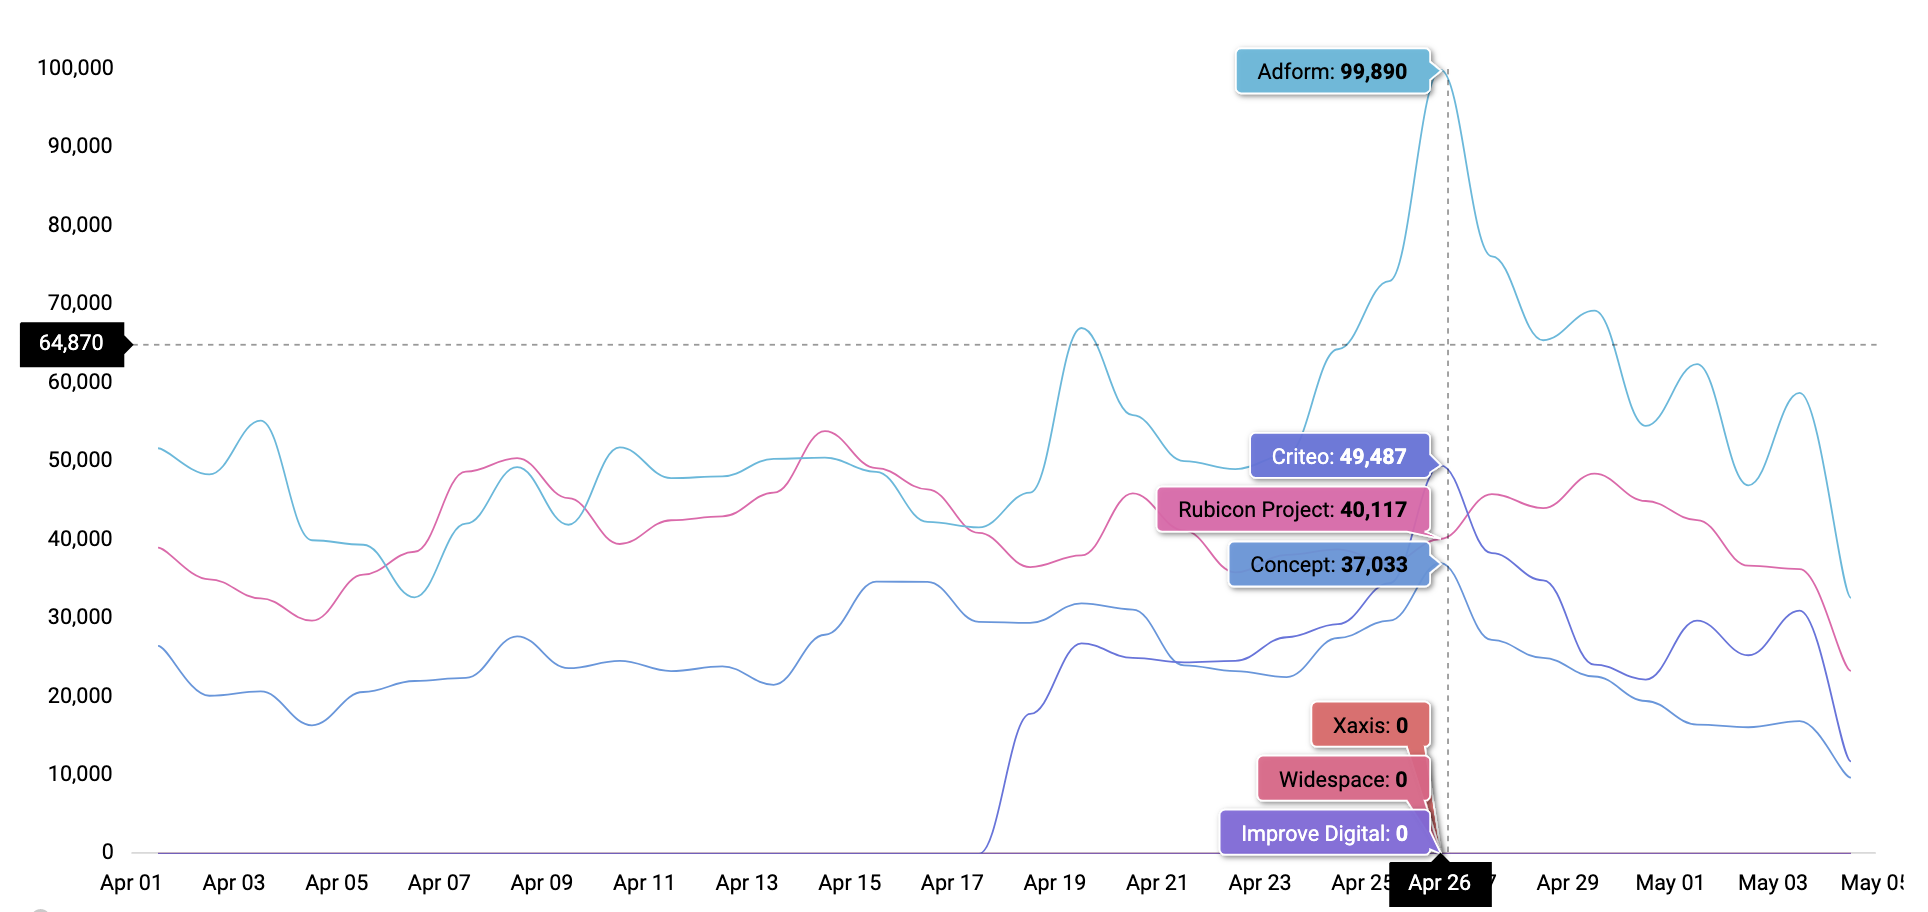
Bidder Performance And Comparison – Graph allows to compare bidders in your account by one bidding parameter for a given timeframe.
Resource Distribution Chart - Funnel chart
Resource Allocation Schedule - Sankey diagram.
Publisher is getting access to reports from the main menu by selecting one:

Report setup process is more or less similar for table reports and graphs, some small changes in place.
On the report setup screen a Publisher selects required Dimensions (#1), apply Filters (#2) and select Metrics (#3). Once ready, a Publisher may click on “Show” or “Export to .xls / .csv” at the bottom of the setup screen and receive report. When needed, a Publisher may get back to setup screen by clicking at appropriate tab at the top of screen and amend some or all parameters.
Filters and Metrics fields, when empty, assume *all available*, when anything selected, it means that report will be limited by that items.

Please find several report examples below. We are constantly working on improve.


